
Labor burden is everything an employee costs you on top of their wage: payroll taxes, workers’ comp, insurance, benefits, and paid time off. Your labor burden rate is that cost divided by their wages. A carpenter you pay $30 an hour can easily cost you more than $42 for every hour they actually work, so an estimate built on the bare wage loses money before the job starts.
This guide lists what goes into labor burden, walks through the calculation for a $30-an-hour carpenter, shows the real cost per billable hour, and gives you a worksheet to run your own numbers.
What goes into labor burden
Some burden costs are set by law and the same for every contractor. Others depend on your state, your trade, and the benefits you offer. Federal rates below are for 2026.
| Cost | How it is calculated | Varies by |
|---|---|---|
| Social Security (employer share) | 6.2% of wages, up to $184,500 per employee | Fixed by law |
| Medicare (employer share) | 1.45% of all wages | Fixed by law |
| Federal unemployment (FUTA) | 6.0% of the first $7,000, usually cut to 0.6% ($42 per employee) by the credit for state unemployment tax | Higher in states with a credit reduction |
| State unemployment (SUTA) | Your state’s rate times its wage base | State and your claims history |
| Workers’ compensation | A rate per $100 of payroll, set by class code | State, trade, and your claims history |
| Liability insurance tied to payroll | Some general liability policies are rated on payroll | Your policy |
| Health insurance | Your share of the monthly premium | Plan and coverage |
| Retirement match | The percentage of wages you match | Your plan |
| Paid time off and holidays | Wages paid for hours not worked | Your policy |
Social Security and Medicare rates and the 2026 wage base come from the Social Security Administration; FUTA rules come from the IRS. Workers’ comp can be one of the largest items for field crews, so get your actual rates from your carrier rather than guessing.
How to calculate your labor burden rate
Work it out per employee for a full year, then divide the burden by their wages.
Labor burden rate = Annual burden costs ÷ Annual wages
Worked example: a $30-an-hour carpenter
The carpenter is paid for 2,080 hours a year (40 hours x 52 weeks), including 10 days of paid time off and 6 paid holidays. That is 128 paid hours not worked, so they work 1,952 hours. Annual wages are $62,400.
| Burden cost | Calculation | Annual cost |
|---|---|---|
| Social Security | 6.2% x $62,400 | $3,869 |
| Medicare | 1.45% x $62,400 | $905 |
| Federal unemployment | 0.6% x $7,000 | $42 |
| State unemployment | Example: 3.0% x $9,000 state wage base | $270 |
| Workers’ comp | Example: $9.00 per $100 of payroll | $5,616 |
| Payroll-rated liability insurance | Example: 1.0% of payroll | $624 |
| Health insurance | Example: $600 a month employer share | $7,200 |
| Retirement match | Example: 3% of wages | $1,872 |
| Total burden | $20,398 |
Labor burden rate: $20,398 / $62,400 = 32.7%. Rows marked “Example” use sample rates; swap in your own from your state agency, your insurance carrier, and your benefit plans.
Turn it into a loaded hourly rate
Your estimates should use the cost of an hour actually worked, not an hour paid. Add wages and burden, then divide by worked hours:
Loaded cost per worked hour = ($62,400 + $20,398) ÷ 1,952 = $42.42
The paid time off is already inside the $62,400 in wages. Spreading it over the 1,952 hours worked is what captures its cost.
From a $30 wage to the real hourly cost
Here is the same carpenter, with every annual cost spread over the hours they actually work.
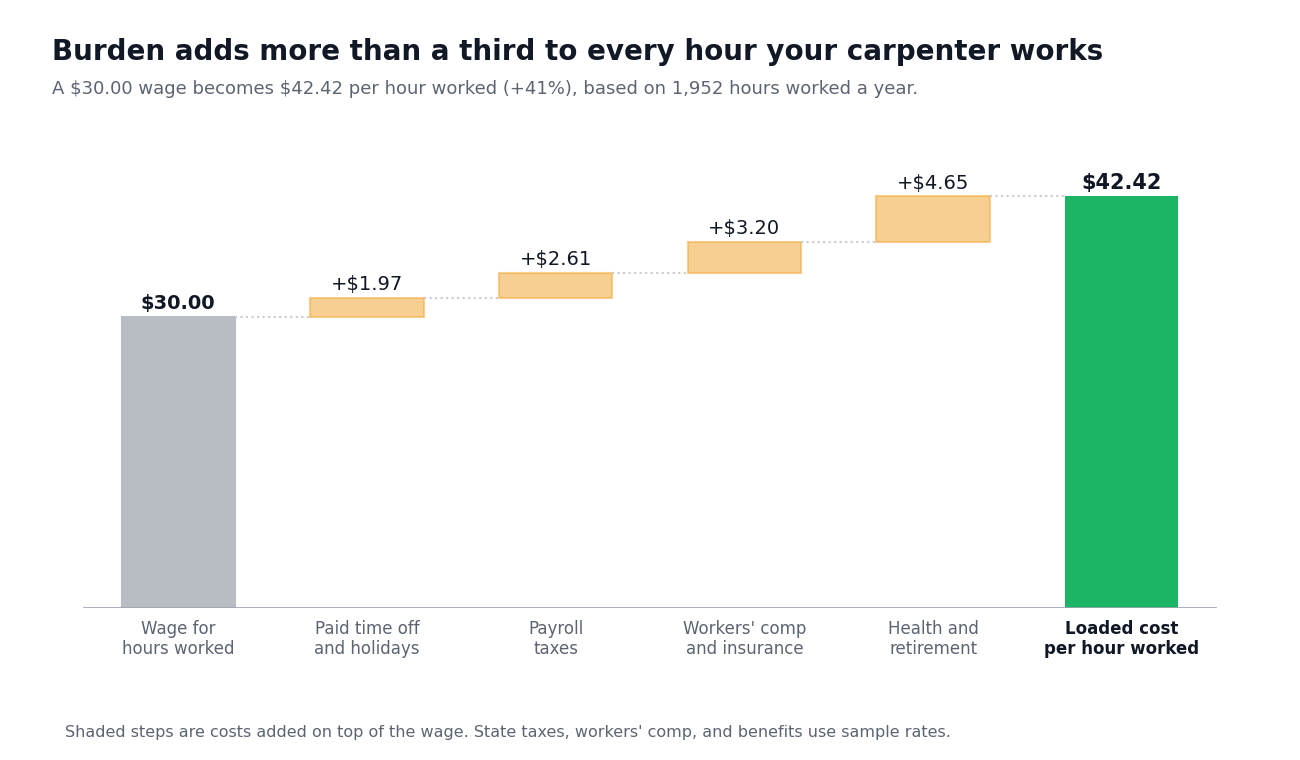
Which step is biggest depends on your state, your trade’s workers’ comp class, and the benefits you offer. Run your own numbers in the worksheet below before you use any of these figures in an estimate.
The real cost of an employee: billable hours
Not every hour worked can be billed to a job. Drive time between jobs, supply runs, shop time, rain days, training, and callbacks all get paid but land on no invoice. That pushes the real cost of each billable hour higher still.
If 85% of the carpenter’s worked hours are billable:
| Step | Value |
|---|---|
| Hours worked per year | 1,952 |
| Share billable to jobs | 85% |
| Billable hours per year | 1,659 |
| Total annual cost (wages + burden) | $82,798 |
| Cost per billable hour | $49.90 |
The carpenter you pay $30 an hour costs you about $50 for every hour you can bill. If your estimates use $30, or even the $42.42 loaded rate, every hour of labor you sell is underpriced before you add a dollar of overhead or profit.
Costs that sit outside the burden rate
Some per-employee costs are usually tracked as overhead rather than burden: recruiting, onboarding time, tools and safety gear, phones, and a truck if the employee has one. Either way, make sure they are counted once, in burden or in overhead, so your prices cover them.
How much revenue should each field employee bring in?
At minimum, each field employee’s billable hours should bring in enough to cover their full cost plus their share of overhead and profit. Start from the cost per billable hour and price it at your target margin:
Labor billing rate = Cost per billable hour ÷ (1 − Target margin) = $49.90 ÷ (1 − 0.30) = $71.29
At $71.29 an hour across 1,659 billable hours, the carpenter’s labor should bring in about $118,000 a year. That covers their $82,798 cost and leaves roughly $35,000 toward overhead and profit. It counts labor only; your markup on materials and subs adds to it.
Track revenue per employee for the whole company too
Divide annual revenue by the number of employees, field and office. One year’s number says little on its own, but the trend says a lot: if revenue per employee falls as you hire, new people are not yet carrying their cost. Our guide to pricing remodeling jobs covers the 30% target margin used here.
Labor burden calculator worksheet
Six steps for each employee or pay rate. Swap the carpenter’s numbers for your own.
| Step | How | Carpenter example |
|---|---|---|
| 1. Annual wages | Hourly wage x paid hours per year | $30 x 2,080 = $62,400 |
| 2. Hours worked | Paid hours minus paid time off and holidays | 2,080 − 128 = 1,952 |
| 3. Total burden | Taxes, workers’ comp, insurance and benefits for the year | $20,398 |
| 4. Burden rate | Total burden ÷ annual wages | $20,398 ÷ $62,400 = 32.7% |
| 5. Cost per worked hour | (Wages + burden) ÷ hours worked | $82,798 ÷ 1,952 = $42.42 |
| 6. Cost per billable hour | (Wages + burden) ÷ (hours worked x billable share) | $82,798 ÷ (1,952 x 85%) = $49.90 |
Recalculate whenever a rate changes: a raise, a new workers’ comp rate at renewal, a new health plan, or the new Social Security wage base each January.
Where software helps
Two numbers in this guide come from your own records: hours worked and the share of them that is billable. Most contractors guess both, because their time records live on paper or in a separate app.
MotionOps tracks them on the job, for contractors whose projects run for days or weeks:
- Time tracking by job, with GPS, so you see billable and non-billable hours
- Timesheet approvals that feed payroll prep and job costs
- Job profitability that shows whether each job’s labor came in on budget
- Proposals built from your numbers, so your loaded labor rate is the rate you sell
Try MotionOps free for 14 days and get your real billable hours from your crew’s time records.